Using Compare Tables
Compare tables are one of the coolest features of Tableau CRM! These allow you to calculate complex calculations quickly. More importantly, you don’t need access to the data layer, and can use the designer to work on use cases in a compare table. (NOTE: Calculations through a compare table are the way to go if you do NOT have access to the data layer)
You can add up to 26 columns in a compare table; additionally as you navigate through a compare table, you can freeze up to 5 columns while you scroll through the remaining data. In order to freeze columns > from a column header’s dropdown menu, select Freeze columns up to here.
So how do you perform a calculation on a compare table?
1) Click the dropdown under the actions menu
2) Navigate columns on the right menu > editing column > if you want to add another column add the + sign to add a new column and use a new column to calculate a formula

To add a new column > select the column > click on the + sign and add a new column
3) Once you are in a compare table, you can add 3 types of formulas:
BASIC FORMULAS
WINDOW FUNCTIONS
These can be used to build more advanced formulas such as when you need a row to reference a previous or next row
There are 5 window functions within the window function: Sliding Window, Percentage of Group, Rank Within Group, Period over Period, Change from Previous, Running Total
To use the window function, select the column you want to reference
RAW FIELD FORMULAS
When using a raw field formula, you can choose a field from the dropdown and quickly apply
USE CASE: Create a Period Over Period Compare Table of the Closed Amounts
For this use case, we will create a Compare Table and create a Period over Period of the Closed Amounts; we will match a trend through the months and see the period over period change.
Steps for this:
1) Chose a dataset for Opportunities and create a new lens called period over period > Sum of amount > bar: close date (year-Month) - now you have the amount over month but I still want to see the change so you immediately wanna go to compare table ->

With this lens, you have the amount over month BUT you still want to see the change
2) Once you have created the new Lens go to a Compare Table > Compare Table Mode
Compare Table -> clone column, edit this column and add a filter
NOTE: You can filter individual columns

Compare table > hover over the dropdown > Clone Column
3) Once the column is cloned, you can can > click the dropdown > edit this column and open the right menu and edit the column (period over period) -
formulas
functions- a lot of date, number, string functions, round, square a lot of functions
fields- select the fields associated w the functions
f(x)- sliding window- percentage of group, rank within group, period over period

Once you select f(x) you can see the dropdown and select the Period over Period -> click apply and see the results in your third column
NOTE: The compare table format is the highest format! This is important to remember when formatting a table
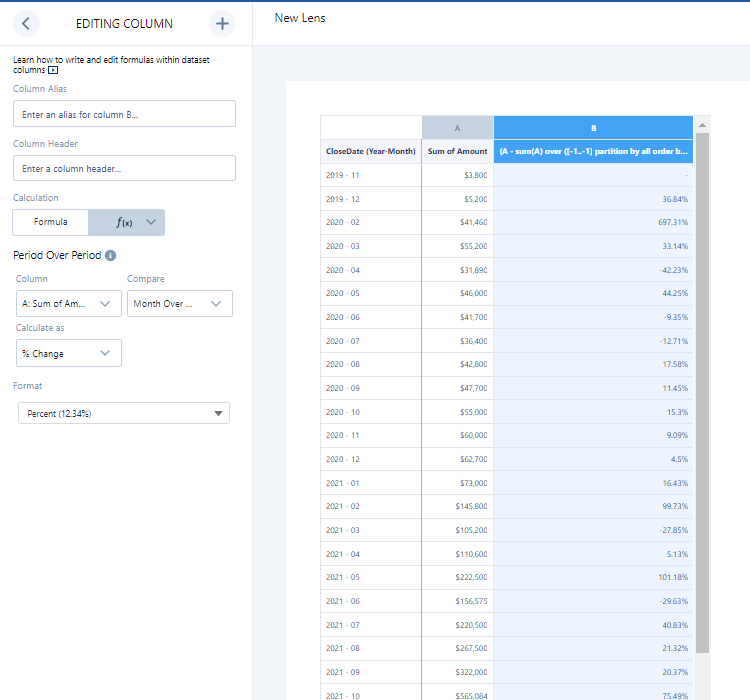
Once you hit apply, you can see the percentage changes in the Compare table
In order to present this, you can either stick to a compare table OR change it to a chart!

Hope this was helpful! If you have any questions please reach out to paulinarueda143@gmail.com