Create a Visualization to see Target vs Actual
As a Sales Manager, do you need to know how your team is doing against their quota? Tableau CRM makes it extremely easy to compare your sales reps’ quotas against their Opportunities in Salesforce. The best thing is you can create a visualization to see this information
Now let’s consider a couple of assumptions:
Assumption #1: Your teams are leveraging Opportunities to track their Pipeline
Assumption #2: Your team Quotas is in a separate csv or excel file that may change year per year
Assumption #3: You have a Tableau CRM license and are ready to create a dataset and start visualizing your data!
So.. let’s start with the first step. You have a csv file with your rep name, date and quota.
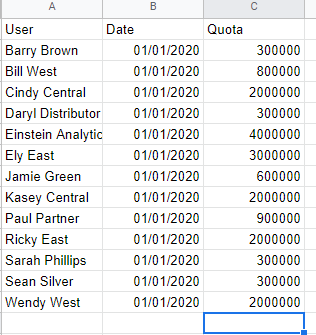
In your sample quota file you have your User name, Date and Quota $$$
Once you have your csv ready you’ll follow the next steps:
Save the quota csv file directly in our computer as a csv file and then just upload the file as a dataset > Go to Analytics Studio > Data Tab > Create Dataset > Select a file from your computer or drop

2. Once you drop your file a box will open with New Dataset > you can create a name and select an app for your dataset > Make sure it’s on the app that’s shared with your team if they will need access to that dataset, if you are the only one that needs access to this Dataset you can save it on “My Private App”
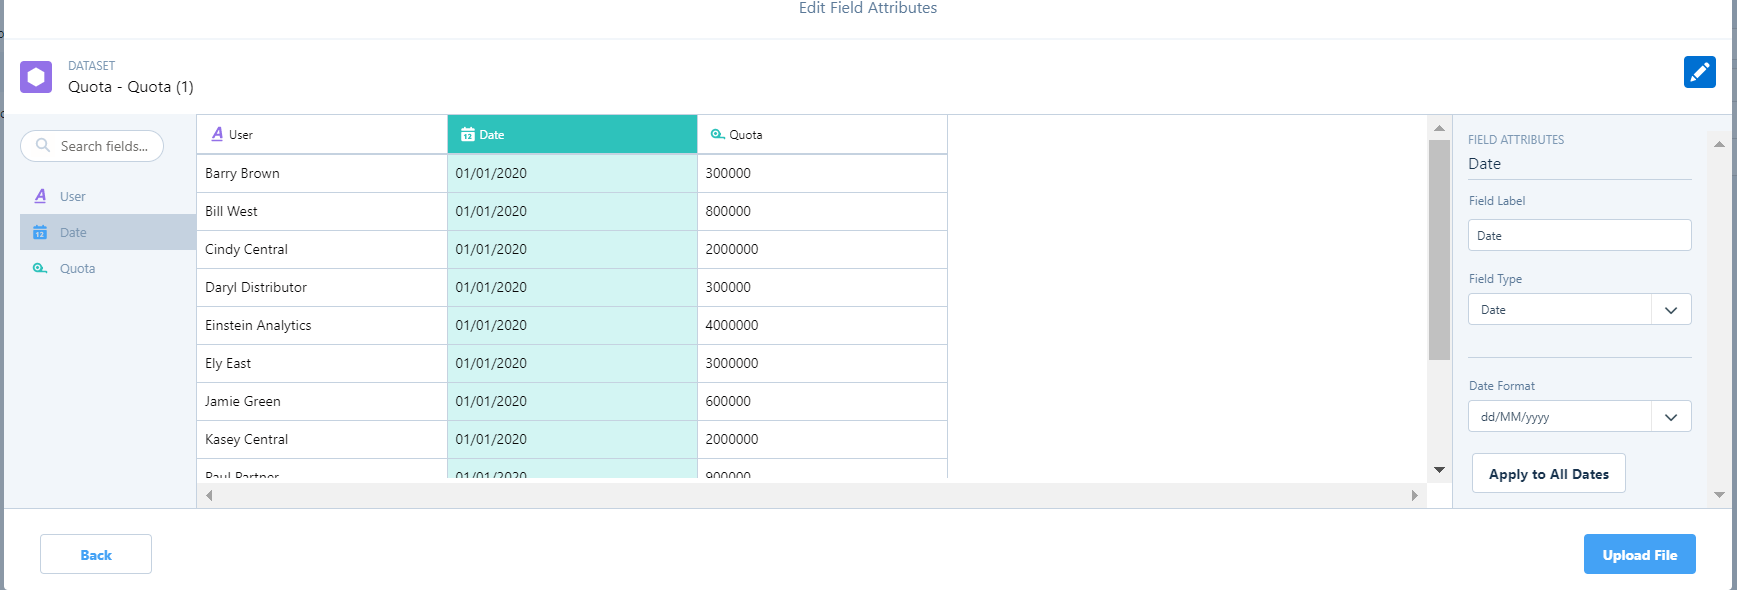
On the right, you can change the Field type if it’s incorrect. Make sure your date fields are formatted as Date!
3. Next you can create a dataset for Opportunities and Users and join your newly created Quota dataset to your Opportunities and users dataset. We will use a Dataflow where you leverage “edgemart transformation” to add your Quota dataset to a dataflow and append it to your Opportunity and User (NOTE: follow this doc for a description of available transformations)
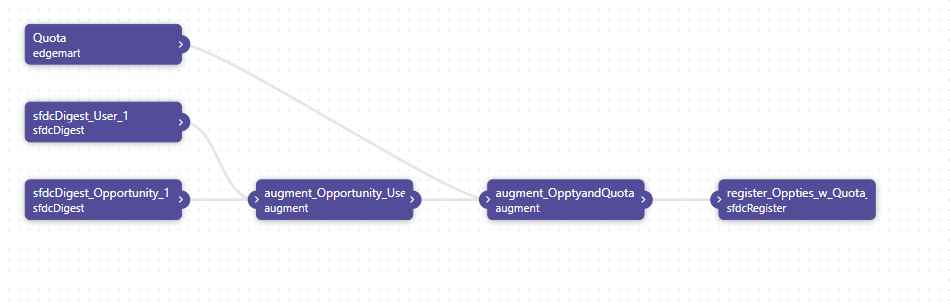
I leveraged my “Default Salesforce Dataflow” and just added 2 sfdc digest nodes to bring in User and Opportunity
4. Once you have added your Quota dataset with the edgemart transformation, augment your Opportunity and user node with your Quota dataset:
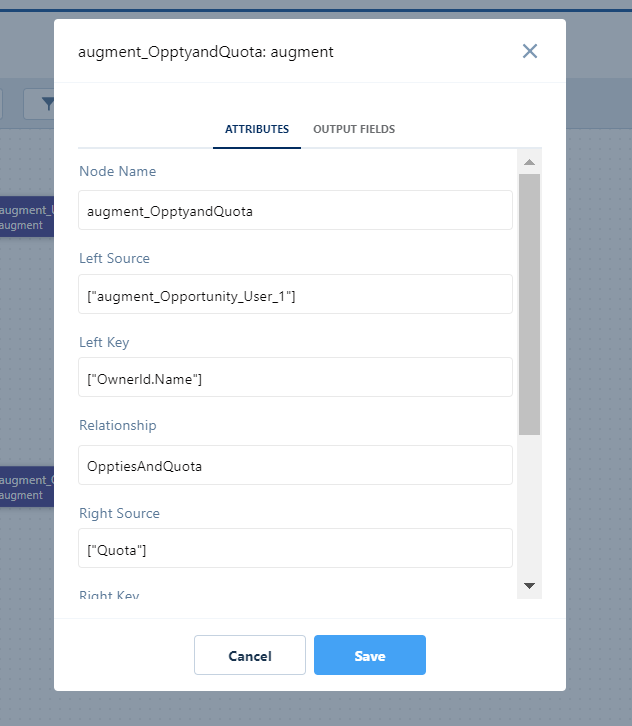
4.1 Simply create a new “augment node” leveraging your Opportunity_user node as Left source and “OwnerId.Name” as your left key and using your Quota as right source and “User” as your right key.
4.2 Finally register your dataset and remember the name!
5. After your dataflow runs, go grab your dataset and Open it for exploration!
5.1 Explore your data in a new lens and bring in “Sum of Amount” and “Sum of quota” and group by your user name. From the chart options select > Combo > Go to your formatting and from Axis Mode select “Dual Axis”
You can change the chart types and play around with it but you should have something like this!


6. Save your lens and add it to your favorite dashboard or share it with someone!
Hope this was helpful, if you have any questions you can reach out to me at paulinarueda143@gmail.com or on Linkedin!